Table Details
The Table Details panel provides real-time monitoring and detailed metadata for any table or materialized view. It displays health status, WAL ingestion metrics, performance alerts, and a full view of the table's DDL, columns, and storage configuration.
Opening Table Details
You can open the Table Details panel by clicking on the information icon next to the table name, or the "View details" context menu option in the Schema Explorer. The panel opens as a drawer on the right side of the Web Console.
Header
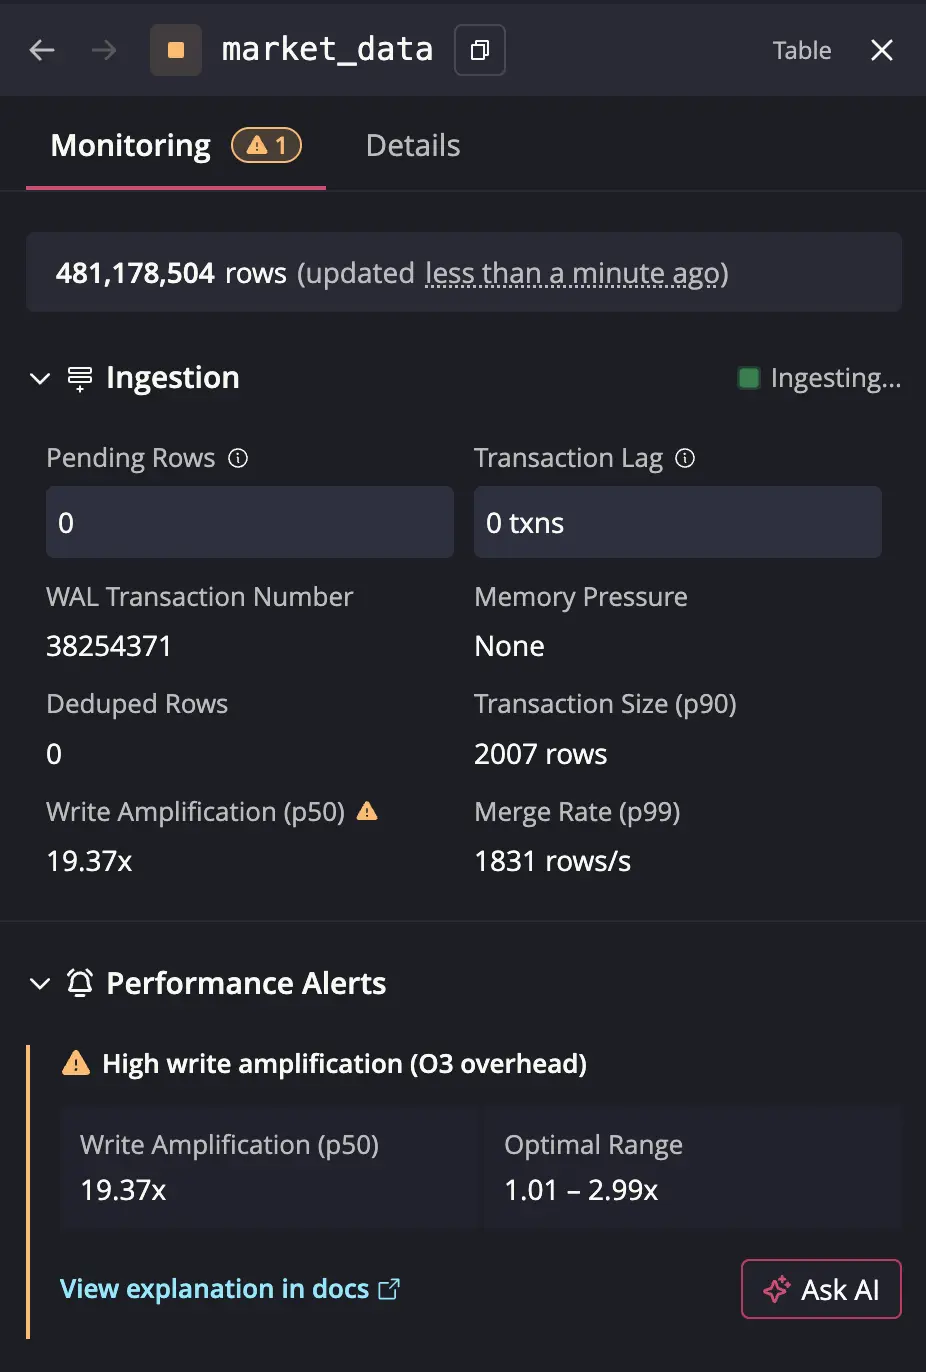
The header displays the following information:
- Health Status Icon: Color-coded indicator showing the overall health of the table (green for healthy, orange for warnings, red for critical issues)
- Table Name: The name of the table or materialized view, with a copy button
- Type Badge: Indicates whether the object is a "Table" or "Materialized View"
The panel is organized into two tabs: Monitoring and Details.
Monitoring Tab
The Monitoring tab provides real-time health and ingestion information. It is the default view when opening the panel.
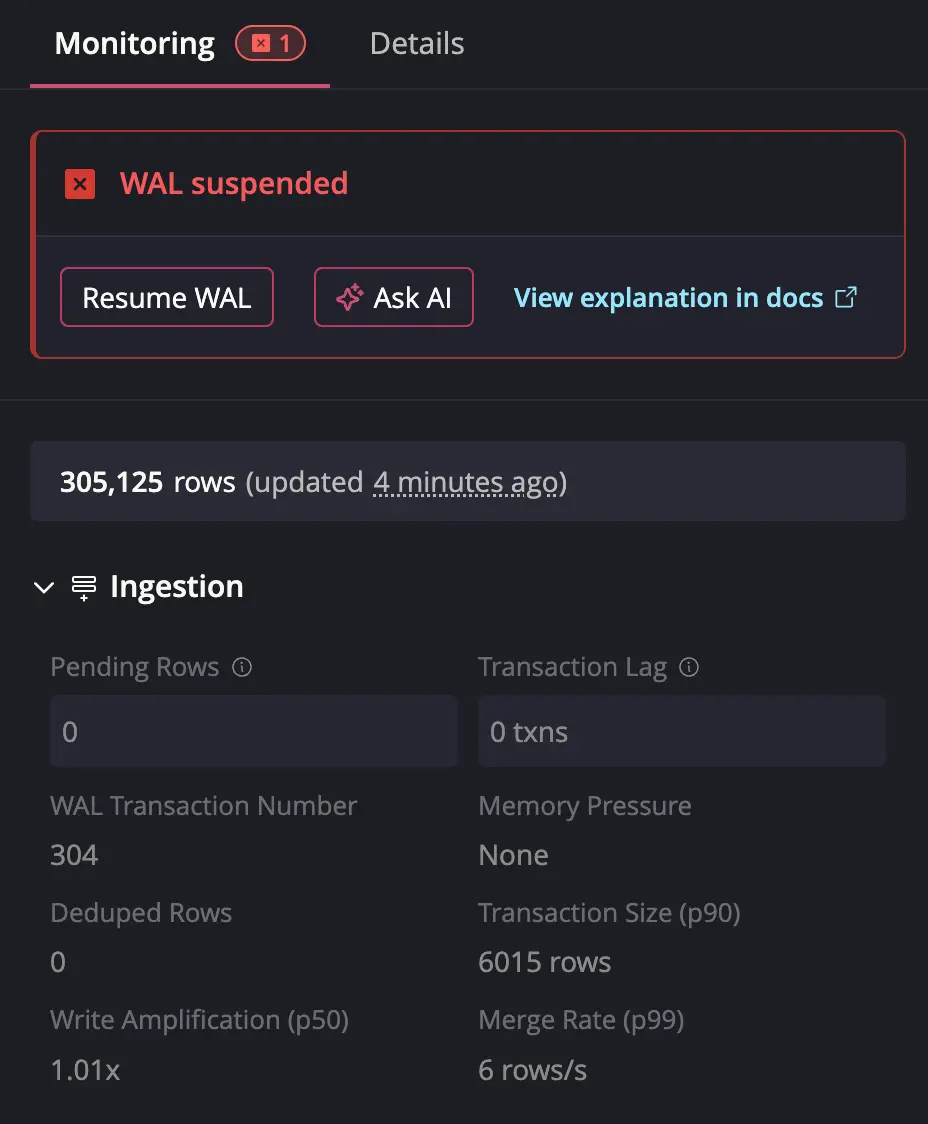
Critical Error Banners
When critical issues are detected, error banners appear at the top of the tab with actionable options:
- WAL Suspended: Shown when Write-Ahead Log operations are suspended. Includes a "Resume WAL" button, an "Ask AI" button, and a link to relevant documentation.
- Materialized View Invalid: Shown when a materialized view is in an invalid state. Displays the invalidation reason along with "Ask AI" and documentation links.
Row Count
Displays the current row count and the last write timestamp. Hover over the timestamp to see the exact ISO timestamp with a copy option.
Materialized View Status
For materialized views, an additional status section shows:
- View Status: Valid, Refreshing, or Invalid
- Base Table Status: Valid, Suspended, or Dropped, with a link to navigate to the base table's details
Ingestion
For WAL-enabled tables, the Ingestion section displays real-time metrics in a two-column grid. This section is collapsible and automatically expands when warnings are detected.
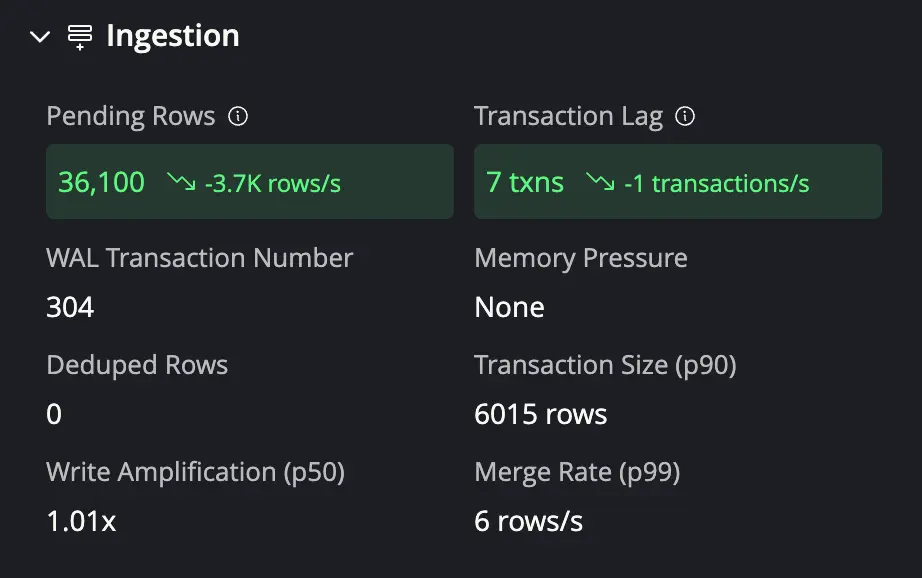
The following metrics are available:
- Pending Rows: Rows waiting in WAL to be written to table storage, with a trend indicator (increasing, decreasing, or stable) and rate
- Transaction Lag: Number of transactions committed to WAL but not yet applied to table storage, with trend indicator and rate
- WAL Transaction Number: Current WAL transaction count
- Memory Pressure: Current memory pressure level (None, Reduced Parallelism, or Backoff)
- Deduped Rows: Total deduplicated rows since table start
- Transaction Size (p90): 90th percentile transaction size in rows
- Write Amplification (p50): Median write amplification ratio
- Merge Rate (p99): 99th percentile merge rate in rows per second
A pulsing indicator appears when active ingestion is detected.
For tables without WAL enabled, the Ingestion section displays a "Write-Ahead Log is disabled" status instead of the metrics grid.
Performance Alerts
When the health check system detects performance issues, alerts are displayed with:
- The issue title and a warning icon
- Current value compared to the optimal value
- An "Ask AI" button for troubleshooting assistance
- A link to the relevant documentation
Details Tab
The Details tab provides structural information about the data source.
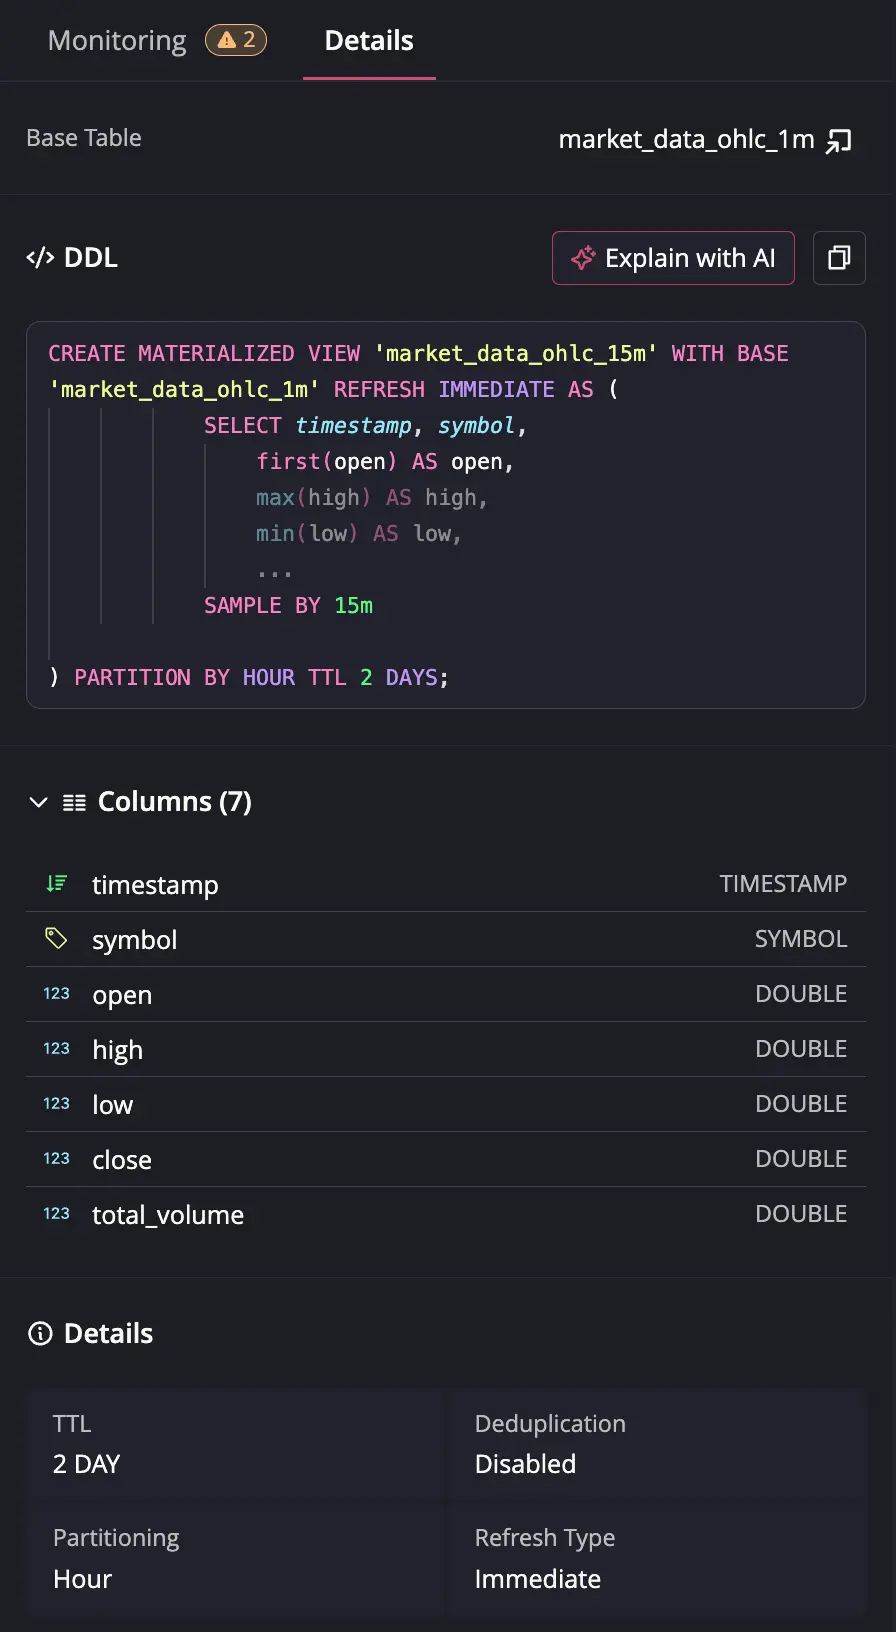
Base Table
For materialized views, this section shows the base table name with a clickable link to navigate to its details.
DDL
Displays the DDL (Data Definition Language) statement for the data source.
Available actions:
- Explain with AI: Opens an AI chat to explain the schema
- Copy: Copies the full DDL to the clipboard
- Open in Editor: Opens the DDL in a preview editor tab
Columns
An expandable list showing all columns with their names and data types. Hover over a column to reveal a copy button for the column name.
Details
A grid displaying key storage configuration:
| Property | Description |
|---|---|
| TTL | Time-to-live value and unit, or "None" |
| Deduplication | Whether deduplication is enabled or disabled |
| Partitioning | Partition strategy of the data source |
| Refresh Type | Refresh mode of a materialized view. See materialized view refresh docs for details |